Cases2Beds

One of the Delphi Group’s goals is to create informative tools for healthcare organizations (actionable intelligence). To address local challenges during the pandemic, we partnered with the Allegheny County Health Department (ACHD). One of our shared worries in early November, 2020, as the case rates in the county continued to increase, was if Allegheny County would run out of hospital beds for COVID patients.
The ACHD needed at least a weeks’ notice to open emergency COVID facilities. If the emergency space wasn’t open and hospital beds ran out, mortality rates would soar. But, if we didn’t need the facility, that decision would have stretched ACHD’s already thin resources. Many of the hospitals in Allegheny County were already in contact with each other, but each hospital system only had visibility into its facilities. We wondered if we could offer a higher-level view for the county.
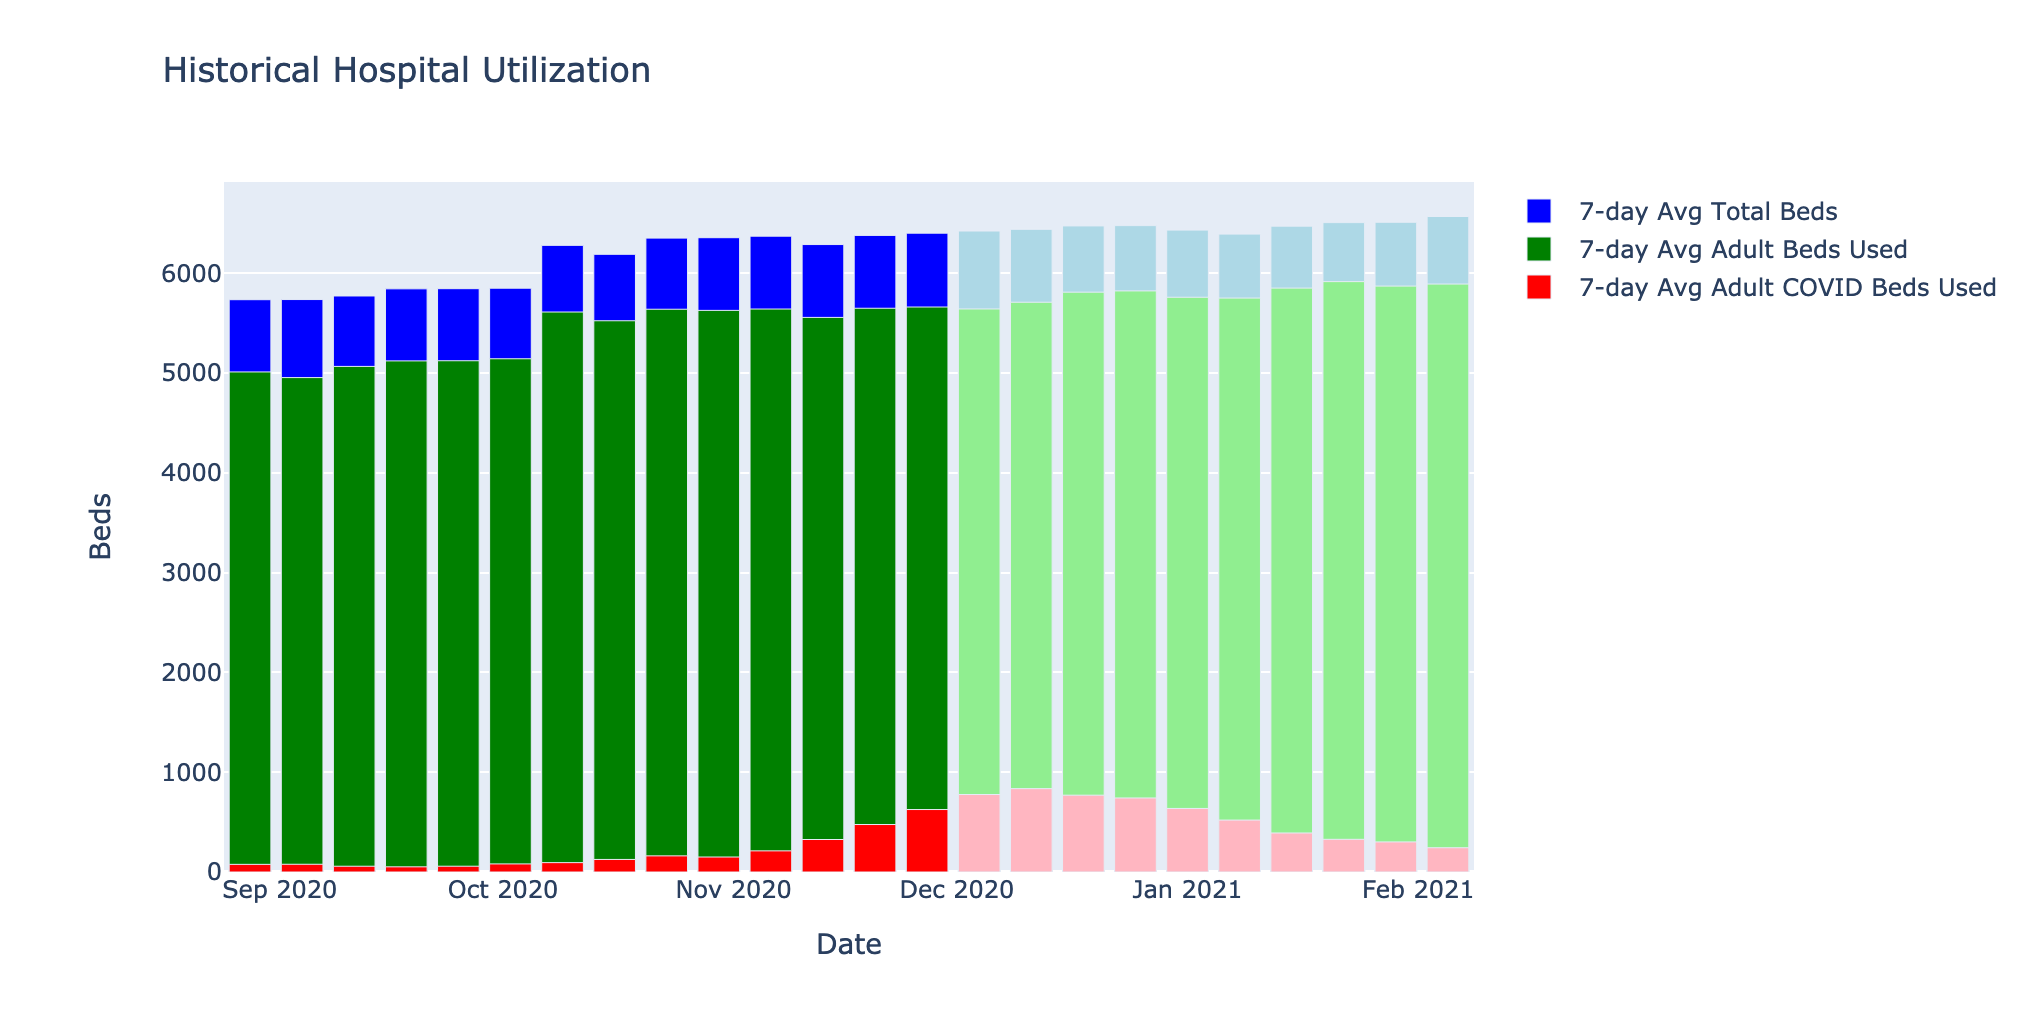
Fig. 1: Hospital beds occupancy in Allegheny county through Dec 11th from HHS Protect Data 2
Actionable intelligence during the pandemic
Our early conversations with ACHD revealed two fundamental problems:
- Data visualization was complex and time intensive
- Trend detection was manual and labor-intensive
The ACHD team spent hours each day wrangling data and then only had time to look at a handful of the data slices worth monitoring. The ACHD worried they would miss a rise in cases in specific demographics due to this confluence of factors.
As the Delphi Group tried to develop solutions to these problems, we consistently ran into data access challenges and bureaucratic limitations to develop solutions at the granularity needed. Carnegie Mellon University did not have a Business Associates Agreement, or BAA, in place with the ACHD. Due to HIPAA laws, that meant we could only operate on public, aggregated and/or redacted data sets. BAAs are commonplace in healthcare, but it is a complex legal agreement that can take months to execute, even in normal circumstances. Without a BAA in place, we couldn’t use detailed COVID testing data classified as Protected Health Information (PHI). Intended projects like setting up mobile testing sites in specific neighborhoods became impossible because public data is aggregated only to the county level. We could not do finer-grained intelligence.
Cases2Beds was more feasible than these monitoring projects because we didn’t need full line-level case and test data, and we could provide intelligence at a county level. The problem specifically called for estimating bed utilization across the entire county. So, Cases2Beds1 was a project we could take forward with the ACHD.
A probabilistic approach
To extrapolate beds utilization 1-2 weeks in the future, we needed to estimate:
- The probability that a person who tested positive for COVID-19 would require a hospitalization
- How many days after the test would a person be hospitalized
- How long a person would stay in the hospital
- The current number of positive COVID tests
These numbers varied widely across three demographic factors: age, sex, and race.
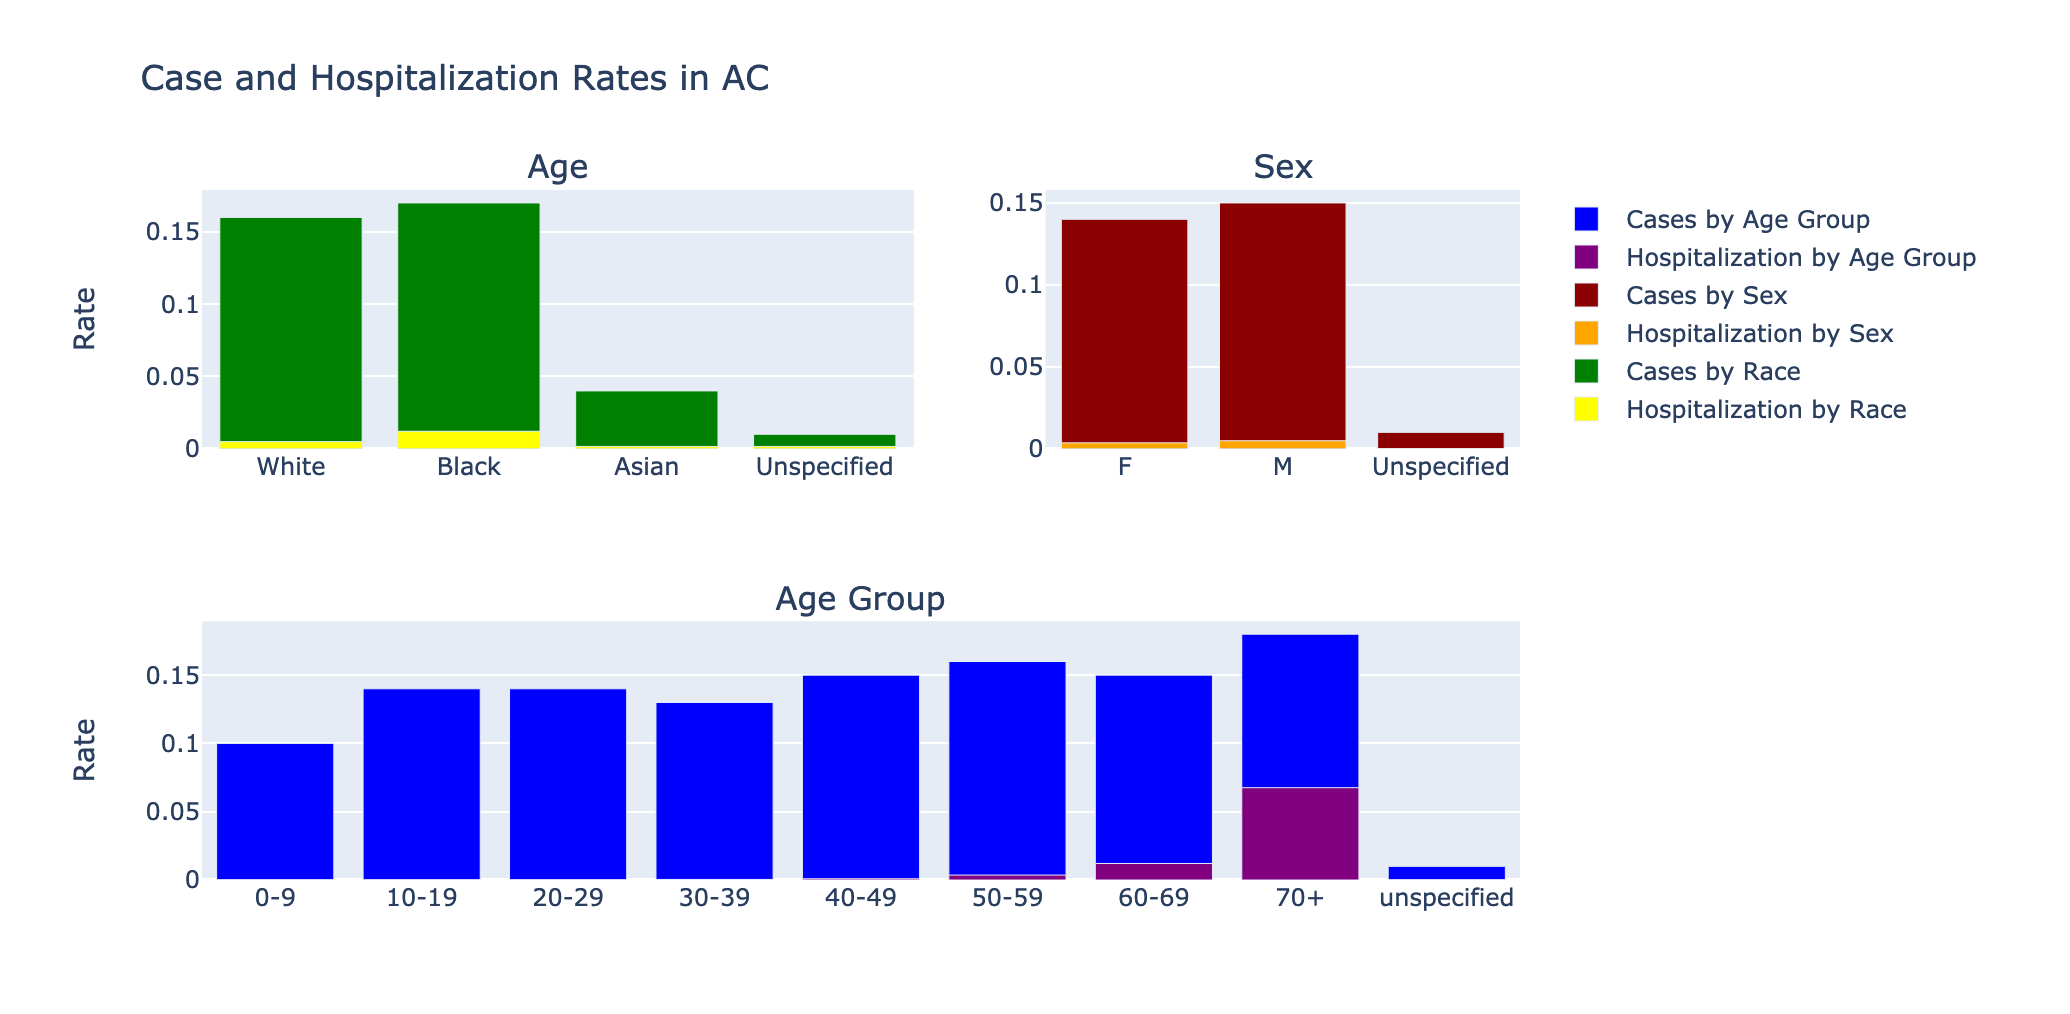
Fig. 2: Demographic Comparisons from the Allegheny County COVID-19 Tableau 3
We used public data from Allegheny County about the number of people tested, test positivity rate, and hospitalization rate by the aforementioned demographic factors. Of these characteristics, we found that age-group was the most important.
We also acquired information for two critical parameters: offset and length of stay. Offset is the number of days between the day of testing (called specimen collection date) and the first day of hospitalization. For example, if the test date is around the hospital admit date, the offset would be 0 days (or sometimes -1 or +1 days). Otherwise, if the test was 5 days before hospitalization, the offset would be 5 days. Notably, the offset can be negative, meaning you may have been tested some days or weeks after being admitted (presumably for an unrelated reason).
The length of stay is how long someone was in the hospital. The length of stay is approximately how long a person uses a bed for (± 1 day). This data helped us understand how long people would be in the hospital.
Given the hospitalization rate, the offset distribution, and the length of stay distribution, we could simulate multiple futures for any given set of positive cases and their testing dates. This process ultimately shows the distribution of the number of beds needed each day.
Estimating the future given a set of probabilities is a common problem and is possible with an approach called a Monte Carlo simulation.
The logistics of actionable intelligence
Monte Carlo simulations involve running a huge number of scenarios based on a set of probabilities. The more scenarios run, the more accurate the model tends to be. For example, if you gave 1000 people one dart to throw at a dart board, even though each individual throw may not be very good, you’d still be able to get a pretty good idea of where the bull’s eye is after 1000 throws. This is the same principle we applied for Cases2Beds - after many simulations, we had a good idea of how many beds might be needed in the next two weeks.
Our prototype Monte Carlo simulation was written in Python and completed in minutes. However, because the simulation works best with probabilities derived from PHI, ACHD needed to run it privately, offline so there would be no data transmission. Thus, any type of web-application (which would transmit data to our servers) was ruled out. Even asking ACHD to run our Python software on their machines fell into a legal grey area. However, Microsoft Excel was easy to use and supported by ACHD. So we converted Cases2Beds into a spreadsheet.
It is relatively straight-forward to port the Python application to VBscript macros. Those macros, however, aren’t designed to run large simulations and we saw that the time required to generate a model was far, far worse, bordering on unusable. An alternative to Monte Carlo: the analytical model As an alternative, we developed an analytical model for Microsoft Excel that offered a much faster run time than a full Monte Carlo simulation.
The analytical model had the same idea as the Monte Carlo simulation. Some fraction of individuals who test positive today will be hospitalized after a varying offset (from test date to admit date) and variable duration (from admit date to discharge date) based on their characteristics. In the spreadsheet, anyone can (and should) change these parameters to fit their region.
The characteristics are: - Age Group: (Most important) [unspecified, 0-9, 10-19, 20-29 … 70-79, 80+] - Sex: [unspecified, M, F] - Race: [unspecified, Black, White, Hispanic, Asian]
And the parameters are: - Hospitalization Rate - Offset Distribution Parameter Set: Parameters describing the number of days before someone who tests positive is hospitalized - Duration Distribution Parameter Set: Parameters describing the number of days someone will be in the hospital
The second types of inputs are the positive cases split by their traits. This is the input that the user actively changes on their end.
Behind the scenes, we take these parameters (first input) and generate Offset Fractions, which is the probability that a patient with given traits will occupy a bed on k days after the specimen testing date. These Offset Fractions and the positive case breakdown (second input) give us the mean and variance of the number of patients in the hospital per day based on the cases already seen up to 1 month in the future. This information can be used to generate plots like Fig 3. This graph isn’t to suggest that there won’t be any need for beds after February! It is just that based on the cases we already know, very few people will remain hospitalized after a month.
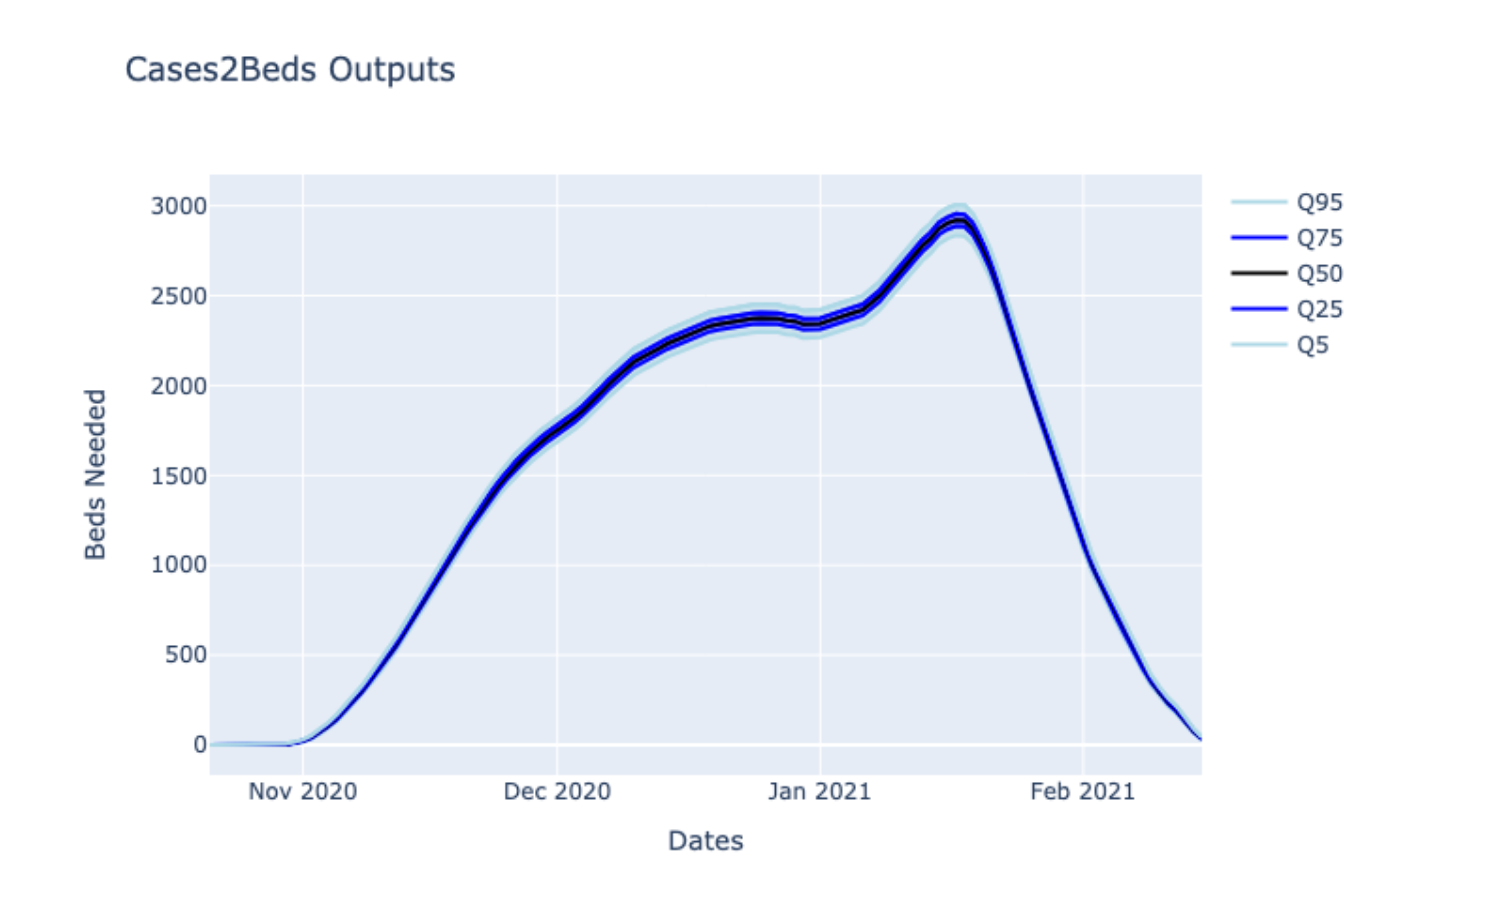
Fig. 3: Output of Cases2Beds using historical data until January 21st for Random US County
If we assume independence between patients, the mean and variance calculations are exact. However, our quantile estimates are based on approximating the sum of independent binary variables, which is inaccurate near the tails. So the accuracy of the more extreme quantiles (95%+) depends on the number of cases present, which in practice makes them less trustworthy.
The only constant during the pandemic is change
By November, we had a prototype Cases2Beds spreadsheet for ACHD that they used. Over the following months, we made various modifications with their feedback. For example, the health departments did not have time to input the case numbers. So, we were able to use the granular public data to give them estimates of future hospital utilization without any inputs on their end. We were also able to showcase the spreadsheet to other health departments and hospitals by generating public parameters for offset and length of stay from various national public resources, like the Florida line-level COVID dataset4. Based on these users’ feedback, we started to use Cases2Beds as an input to hospital utilization forecasting models. Other inputs include current hospital bed utilization (from HHS Protect2), how long current patients are likely to continue to be hospitalized, and how many new cases there will be in the near future. A preliminary evaluation of such a method shows decent predictive power where Cases2Beds is an important factor in these regressions:
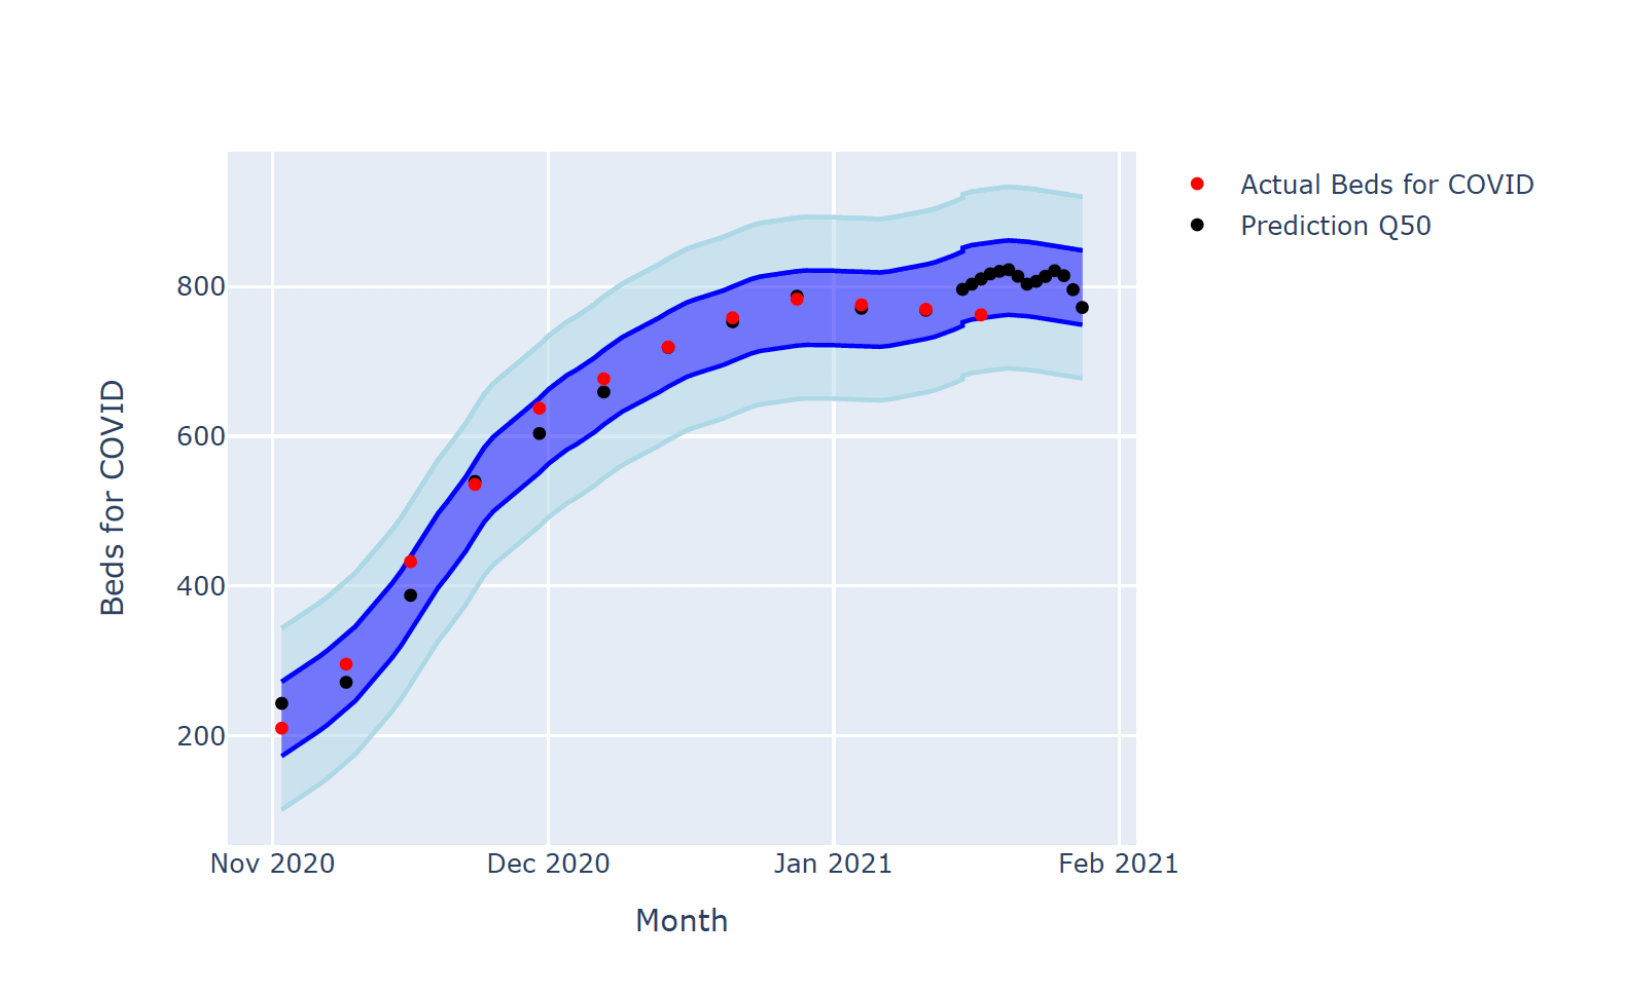
Fig. 4: Hospital Utilization Prediction vs. Usage for a Random Region
At the peak of bed utilization, hospital systems themselves increased their COVID beds capacity by up to 6x. Fortunately, in Allegheny County, we never reached a point where demand for cases exceeded this somewhat elastic supply. By early January, multiple organizations told us that the pandemic’s most acute problem had changed to vaccine distribution and the number of beds needed dropped. Cases2Beds continues to act as an early warning system if the number of cases rise quickly, but hopefully the worst is now over.
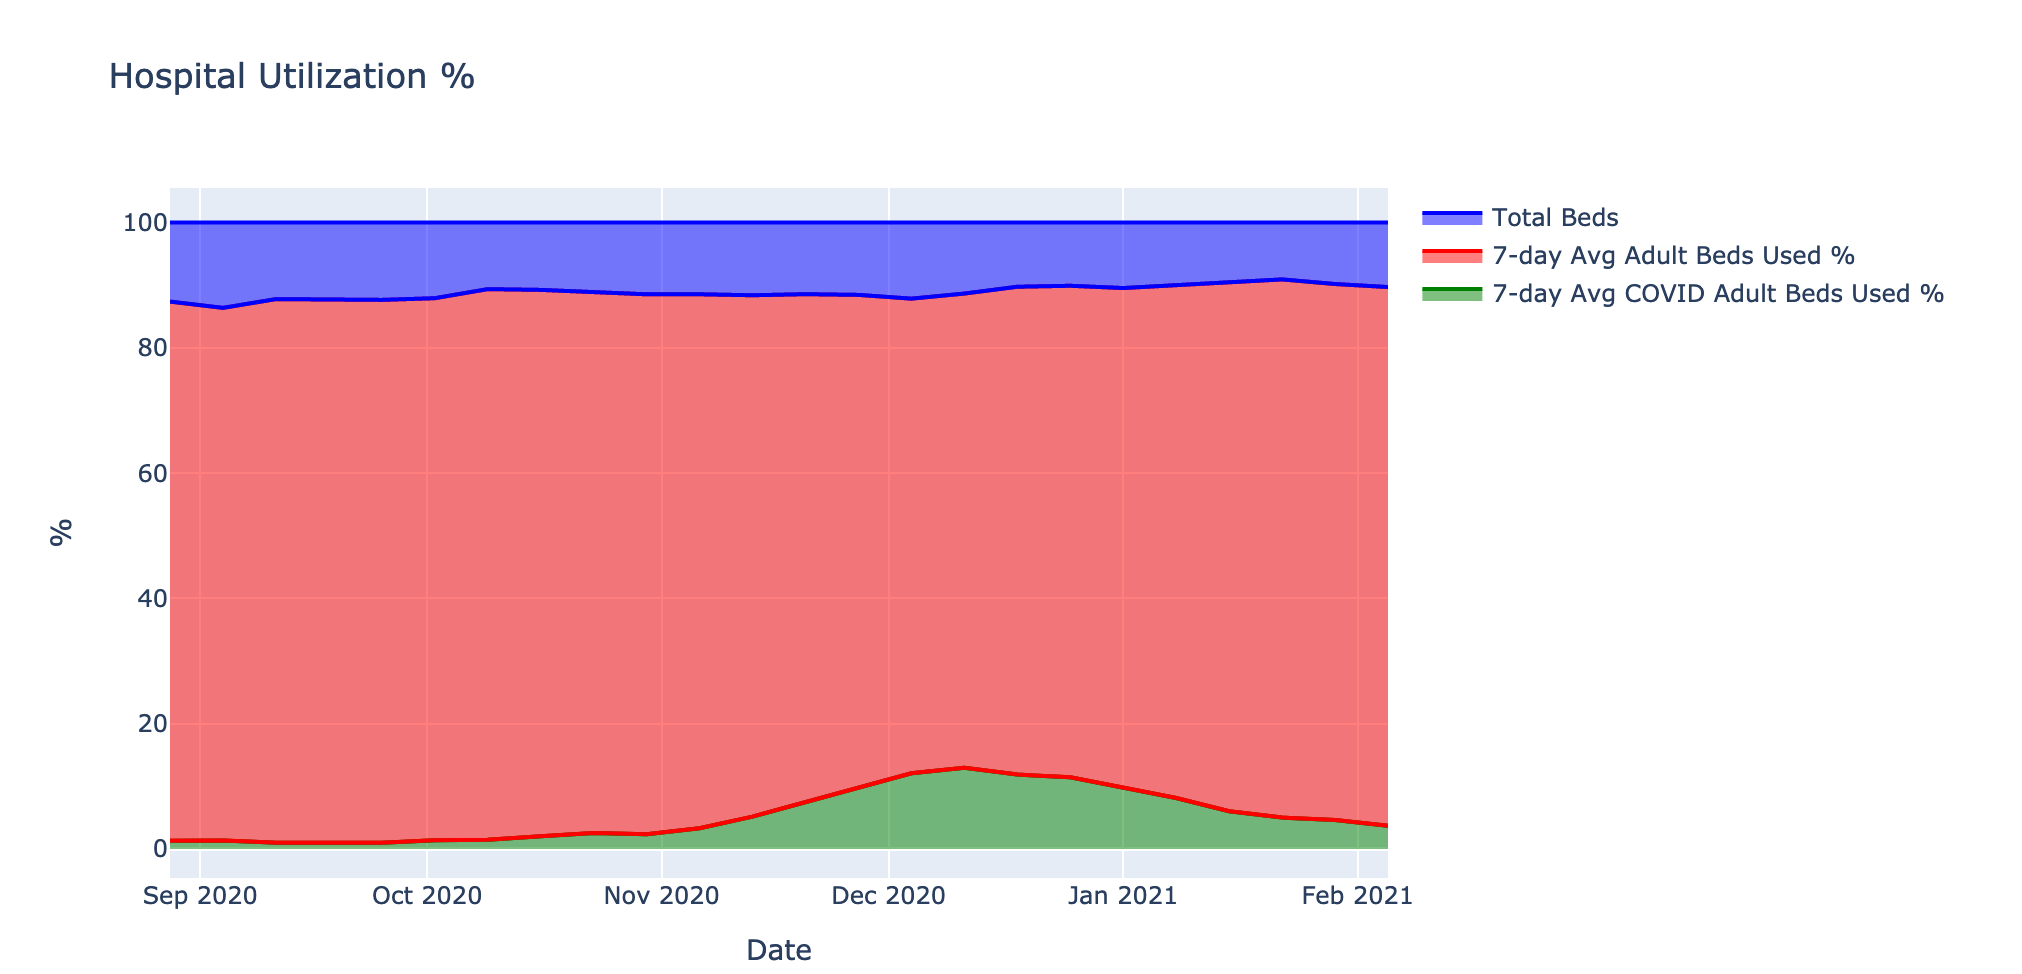
Fig. 5: Numbers of staffed COVID beds over time vs. capacity from the HHS Protect Data2
Conclusion
Cases2Beds was a case study about the realities of research institutions offering actionable intelligence in healthcare. Due to the ever-changing nature of the problems introduced by the pandemic and because of logistical and legal restrictions in getting access to line-level PHI data, offering timely, actionable intelligence was complex. The lessons learned will help us prepare for future challenges in providing actionable intelligence. We also hope that the C2B infrastructure will apply to other public health inquiries in the future.
Resources
Acknowledgements: TODO Andrew Chin, Ananya Joshi, Katie Mazaitis, Phil McGuinness, Chris Scott, Benjamin Smith, Roni Rosenfeld, Spencer Whitman, DELPHI Group at CMU


